USDA updated the Plant Hardiness Zone Map, and half the country has shifted
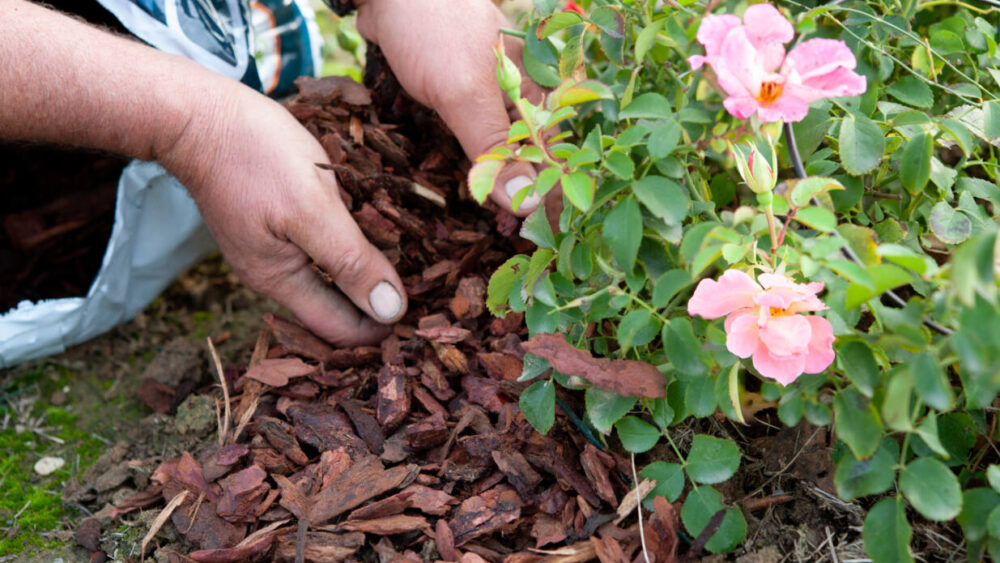
Anyone who loves gardening knows the importance of understanding their area’s growing conditions. To help farmers and gardeners lay the foundation for their crops and gardens, the United States Department of Agriculture has a Plant Hardiness Zone Map. For the first time since 2012, the USDA announced an update to this valuable resource — and the differences are significant.
“Overall, the 2023 map is about 2.5 degrees warmer than the 2012 map across the conterminous United States,” Christopher Daly, director of the PRISM Climate Group at Oregon State University, which worked with USDA to create the updated map, said in a statement.
“This translated into about half of the country shifting to a warmer 5-degree half zone, and half remaining in the same half zone. The central plains and Midwest generally warmed the most, with the southwestern U.S. warming very little.”

MORE: How to plant and grow a thriving wildflower garden
All temperature data collected by the USDA came from the Geographic Information System (GIS) at PRISM at Oregon State University. The computer system compiled 30-year average temperature information from around the U.S.
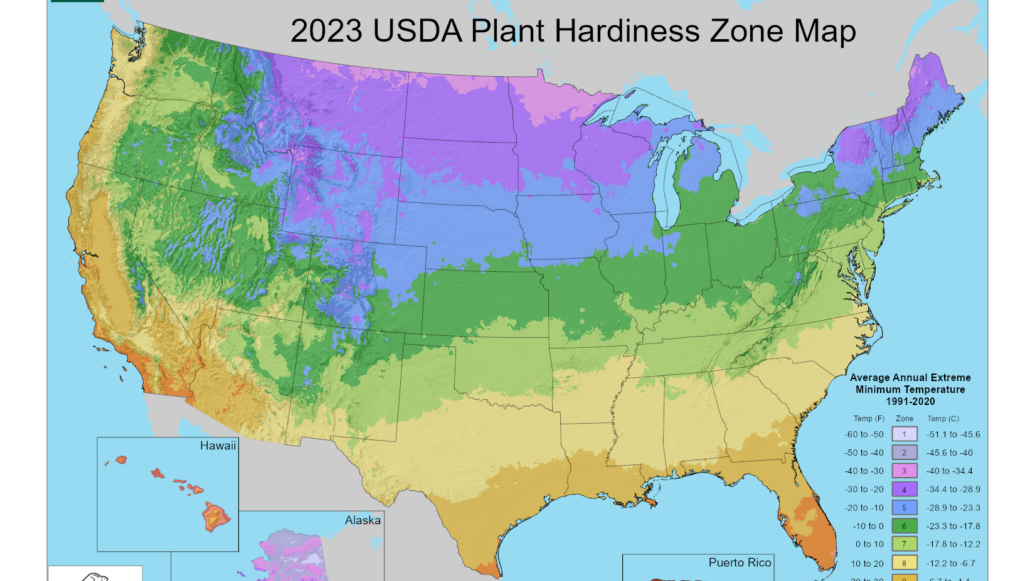
The map and its zone system are designed to help gardeners and farmers understand a plant’s ability to survive the winter and thrive where they live, so one of the major factors in creating the map is tracking the lowest winter temperatures, which are calculated on a 30-year average. The map is divided into full zones based on average yearly minimum winter temperatures, with each zone representing ranges of 10 degrees Fahrenheit and half zones of 5 degrees Fahrenheit.
There are 13 full zones (with 1 being the coldest and 13 being the warmest). Each full zone is also divided into half zones. The USDA draws the map using a color-coded key for easier reference.
Though it was last updated in 2012, the previous map used weather data from 1974 to 1986. In recent decades, climate patterns have changed, meaning temperature zone borders need to shift.
The graphic below shows the widespread changes in half-zone areas because of long-term temperature changes. These fluctuations affect the kind of plants growers should plant and at what time of year.

MORE: 5 gardening mistakes that could spell doom for your plants
If you’re a gardener, you’ll want to check the updated interactive USDA Hardiness Zone Map when planning your gardens and before buying seeds or plants for next year. The interactive map has a searchable feature down to the ZIP code location for the most accurate zone designation, and seeds and plants should have a zone designation on the tag for quick reference.
Related posts